
Explanatory variables that cannot be controlled or fixed: Does the regression work?
DOI:
https://doi.org/10.25260/EA.20.30.3.0.1066Keywords:
independent variables, explanations with error, simulations, biasAbstract
Linear regression analysis is one of the most used statistical techniques in experiments planned to study the functioning of natural systems, especially in measurable studies. Many times, the researcher does not have the ability to control the explanatory portion of the regression model, so the explanatory variables can be as random or more than the response variable. This could generate biases in the estimates of the associated slopes and lead to wrong conclusions. An alternative to the classical regression method is type II regression when the values of the explanatory variable cannot be controlled. This paper presents different situations based on published research in ecology and agronomy for different purposes: prediction, estimate of the slope and comparison of slopes between two groups, in which the problem of random variation in the explanatory variables is present with different degrees of relevance. In each case, the most appropriate path for the analysis will be identified. A simulation was also carried out that considered different combinations for the random errors in the regressor and response variables in order to visualize the bias of the estimators in each situation for the different regression methods. It is clear from the foregoing that it is necessary to emphasize two very important issues in order to decide the most appropriate type II regression method: be clear about the objective of the work and if the application conditions required by each method are met. This review aims to be a simple guide to when and what method to apply in each situation.
References
Bland, J. M., and D. G. Altman. 1999. Measuring agreement in method comparison studies. Statistical Methods in Medical Research 8(2):135-160. https://doi.org/10.1177/096228029900800204.
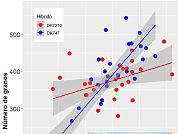
Ciancio, N., M. Parco, S. J. P. Incognito, and G. A. Maddonni. 2016. Kernel setting at the apical and sub-apical ear of older and newer Argentinean maize hybrids. Field Crops Research 191:101-110. https://doi.org/10.1016/j.fcr.2016.02.021.
Correndo, A. A., F. Salvagiotti, F. O. García, and F. H. Gutiérrez-Boem. 2017. A modification of the arcsine-log calibration curve for analysing soil test value–relative yield relationships. Crop and Pasture Science 68(3):297-304. https://doi.org/10.1071/CP16444.
Draper, N. R., and H. Smith. 2014. Applied regression analysis (Vol. 326). John Wiley and Sons.
Faraway, J. J. 2016. Extending the linear model with R: generalized linear, mixed effects and nonparametric regression models. Vol. 124. CRC press. https://doi.org/10.1201/9781315382722.
Fassola, H. E., F. A Moscovich, P. Ferrere, and F. Rodríguez. 2002. Evolución de las principales variables de árboles de Pinus taeda L. sometidos a diferentes tratamientos silviculturales en el nordeste de la provincia de Corrientes, Argentina. Ciência Florestal 12(2). https://doi.org/10.5902/198050981680.
Francq, B. G., and B. B. Govaerts. 2014. Measurement methods comparison with errors-in-variables regressions. From horizontal to vertical OLS regression, review and new perspectives. Chemometrics and Intelligent Laboratory Systems 134:123-139. https://doi.org/10.1016/j.chemolab.2014.03.006.
Gillard, J. W. 2006. An historical overview of linear regression with errors in both variables. Math. School, Cardiff Univ., Wales, UK, Tech. Rep.
Harper, J. L. 1977. Population biology of plants. Academic Press, New York.
Hurlbert, S. H. 1984. Pseudoreplication and the design of ecological field experiments. Ecological Monographs 54(2):187-211. https://doi.org/10.2307/1942661.
Jolicoeur, P. 1990. Bivariate allometry: interval estimation of the slopes of the ordinary and standardized normal major axes and structural relationship. Journal of Theoretical Biology 144(2):275-285. https://doi.org/10.1016/S0022-5193(05)80326-1.
Legendre, P., and L. F. Legendre. 2012. Numerical ecology. Vol. 24. Elsevier.
Legendre, P. 1998. Model II regression user’s guide, R edition. R Vignette, 14.
Legendre, P. 2015. lmodel2: Model II Regression. R package version 1.7-2.
Ludbrook, J. 2012. A primer for biomedical scientists on how to execute model II linear regression analysis. Clinical and Experimental Pharmacology and Physiology 39(4):329-335. https://doi.org/10.1111/j.1440-1681.2011.05643.x.
Marti, J., and G. A. Slafer. 2014. Bread and durum wheat yields under a wide range of environmental conditions. Field Crops Research 156:258-271. https://doi.org/10.1016/j.fcr.2013.10.008.
R Core Team. 2019. R: A language and environment for statistical computing. R Foundation for Statistical Computing, Vienna, Austria.
Smith, R. J. 2009. Use and misuse of the reduced major axis for line‐fitting. American Journal of Physical Anthropology: The Official Publication of the American Association of Physical Anthropologists 140(3):476-486. https://doi.org/10.1002/ajpa.21090.
Sokal, R. R., and F. J. Rohlf. 1995. Biometry. Freeman. New York. US.
Taskinena, S., and D. I. Wartona. 2013. Robust tests for one or more allometric lines. Journal of Theoretical Biology 333(21):38-46. https://doi.org/10.1016/j.jtbi.2013.05.010.
Warton, D. I., I. J. Wright, D. S. Falster, and M. Westoby. (2006). Bivariate line-fitting methods for allometry. Biological Reviews 81(2):259-291. https://doi.org/10.1017/S1464793106007007.
Warton, D. I., R. A. Duursma, D. S. Falster, and S. Taskinen. 2012. smatr 3-an R package for estimation and inference about allometric lines. Methods in Ecology and Evolution 3(2):257-259. https://doi.org/10.1111/j.2041-210X.2011.00153.x.
Yoda, K. 1963. Self-thinning in overcrowded pure stands under cultivated and natural conditions (Intraspecific competition among higher plants. XI). J. Inst. Polytech. Osaka City Univ Ser D 14:107-129.
Downloads
Additional Files
Published
How to Cite
Issue
Section
License
Copyright (c) 2020 Teresa Boca; Adriana Pérez, Susana Perelman

This work is licensed under a Creative Commons Attribution 3.0 Unported License.
Authors retain their rights as follows: 1) by granting the journal the right to its first publication, and 2) by registering the published article with a Creative Commons Attribution License (CC-BY 4.0), which allows authors and third parties to view and use it as long as they clearly mention its origin (citation or reference, including authorship and first publication in this journal). Authors can make other non-exclusive distribution agreements as long as they clearly indicate their origin and are encouraged to widely share and disseminate the published version of their work.

