
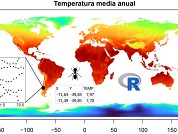
R as a GIS: WorldClim climate data extraction
DOI:
https://doi.org/10.25260/EA.22.32.1.0.1119Keywords:
teaching aid, R project, georeferenced data, spatial analysis, diversity, macroecology, climatic changeAbstract
Characterizing sampling sites based on climatic data is a key need for a significant number of professionals working in ‘ ecology. In general terms, so is the use of GIS (Geographic Information Systems) tools. However, accessing the use of available online climatic databases and GIS tools is a challenge. This paper shows how to use R as a GIS to obtain values of climatic variables for geo-referenced sampling sites, using the WorldClim database, which contains climatic information for the entire globe. Firstly, there is a description of the WorldClim database. A bibliographic search shows the frequency of use of WorldClim and the topics of study. It is concluded that the use of this database has been increasing over the years, and currently it is massively used. The United States is the country that uses it most frequently. In Argentina, 420 publications cite this database, and the topics that are most frequently addressed are linked to ecology. Secondly, a step-by-step routine for extracting data from WorldCim data base is presented. In addition, the reasons for using R as a GIS are described and an introduction to the management of spatial objects in R is included. Upon completion of the routine, the values ‘ of 19 bioclimatic variables related to precipitation and temperature are obtained for a series of sampling sites and the results are displayed on maps. The routine is also an introduction to the use of R as a GIS. The information presented has direct application for professionals in the field of ecology. The explanations are complemented with graphics so that the material can be included in exercise guides in undergraduate or graduate courses.
References
Aria, M., and C. Cuccurullo. 2017. Bibliometrix: An R-tool for comprehensive science mapping analysis. Journal of Informetrics 11:959-975. https://doi.org/10.1016/j.joi.2017.08.007.
Bivand, R. S., E. J. Pebesma, V. Gómez-Rubio, and E. J. Pebesma. 2008. Applied spatial data analysis with R. Springer.
Bustos, M. L., F. Ferrelli, and M. C. Piccolo. 2017. Estudio comparativo de tres modelos climáticos en Argentina. Universidade Federal do Rio de Janeiro. Anuário do Instituto de Geociências 40:34-43. https://doi.org/10.11137/2017_1_34_43.
Escobar, L. E., A. Lira-Noriega, G. Medina-Vogel, and A. T. Peterson. 2014. Potential for spread of the white-nose fungus (Pseudogymnoascus destructans) in the Americas: use of Maxent and NicheA to assure strict model transference. Geospatial Health 9(1):221-229. https://doi.org/10.4081/gh.2014.19.
Fergnani, P. N., and J. Filloy. 2021. Desde la areografía de Rapoport a los 30 años de la macroecología: Síntesis de la contribución argentina. Ecología Austral 31:101-113. https://doi.org/10.25260/EA.21.31.1.0.1134.
Fergnani, P. N., P. Sackmann, and A. Ruggiero. 2010. Richness environment relationships in epigaeic ants across the Subantarctic Patagonian transition zone. Insect Conservation and Diversity 3:278-290. https://doi.org/10.1111/j.1752-4598.2010.00105.x.
Fick, S. E., and R. J. Hijmans. 2017. WorldClim 2: new 1‐km spatial resolution climate surfaces for global land areas. International Journal of Climatology 37:4302-4315. https://doi.org/10.1002/joc.5086.
Hijmans, R. J. 2020. Raster: Geographic Data Analysis and Modeling. R package version 3.4-5. https://CRAN.R-project.org/package=raster.
Hijmans, R. J., S. E. Cameron, J. L. Parra, P. G. Jones, and A. Jarvis. 2005. Very high resolution interpolated climate surfaces for global land areas. International Journal of Climatology 25:1965-1978. https://doi.org/10.1002/joc.1276.
Marchi, M., I. Sinjur, M. Bozzano, and M. Westergren. 2019. Evaluating WorldClim Version 1 (1961-1990) as the Baseline for Sustainable Use of Forest and Environmental Resources in a Changing Climate. Sustainability 11:3043. https://doi.org/10.3390/su11113043.
Mas, F. J. 2018. Análisis espacial con R: Usa R como un Sistema de Información Geográfica. European Scientic Institute, Macedonia.
Núñez-Penichet, C., L. Osorio-Olvera, V. H. González, M. E. Cobos, L. Jiménez, D. A. DeRaad, A. Alkishe, R. G. Contreras-Díaz, A. Nava-Bolaños, and K. Utsumi. 2021. Geographic potential of the world’s largest hornet, Vespa mandarinia Smith (Hymenoptera: Vespidae), worldwide and particularly in North America. PeerJ 9:e10690. https://doi.org/10.7717/peerj.10690.
Olaya, V. 2014. Sistemas de Información Geográfica. Un libro libre de Victor Olaya. URL: volaya.github.io/libro-sig.
R Core Team. 2019. R: A language and environment for statistical computing R Foundation for Statistical Computing, Vienna, Austria. URL: R-project.org.
Downloads
Additional Files
Published
How to Cite
Issue
Section
License
Copyright (c) 2022 Paula N. Fergnani

This work is licensed under a Creative Commons Attribution 3.0 Unported License.
Authors retain their rights as follows: 1) by granting the journal the right to its first publication, and 2) by registering the published article with a Creative Commons Attribution License (CC-BY 4.0), which allows authors and third parties to view and use it as long as they clearly mention its origin (citation or reference, including authorship and first publication in this journal). Authors can make other non-exclusive distribution agreements as long as they clearly indicate their origin and are encouraged to widely share and disseminate the published version of their work.

